How it’s counted
Average adults with Sunday evidence each week, divided by the average adult headcount.
For example
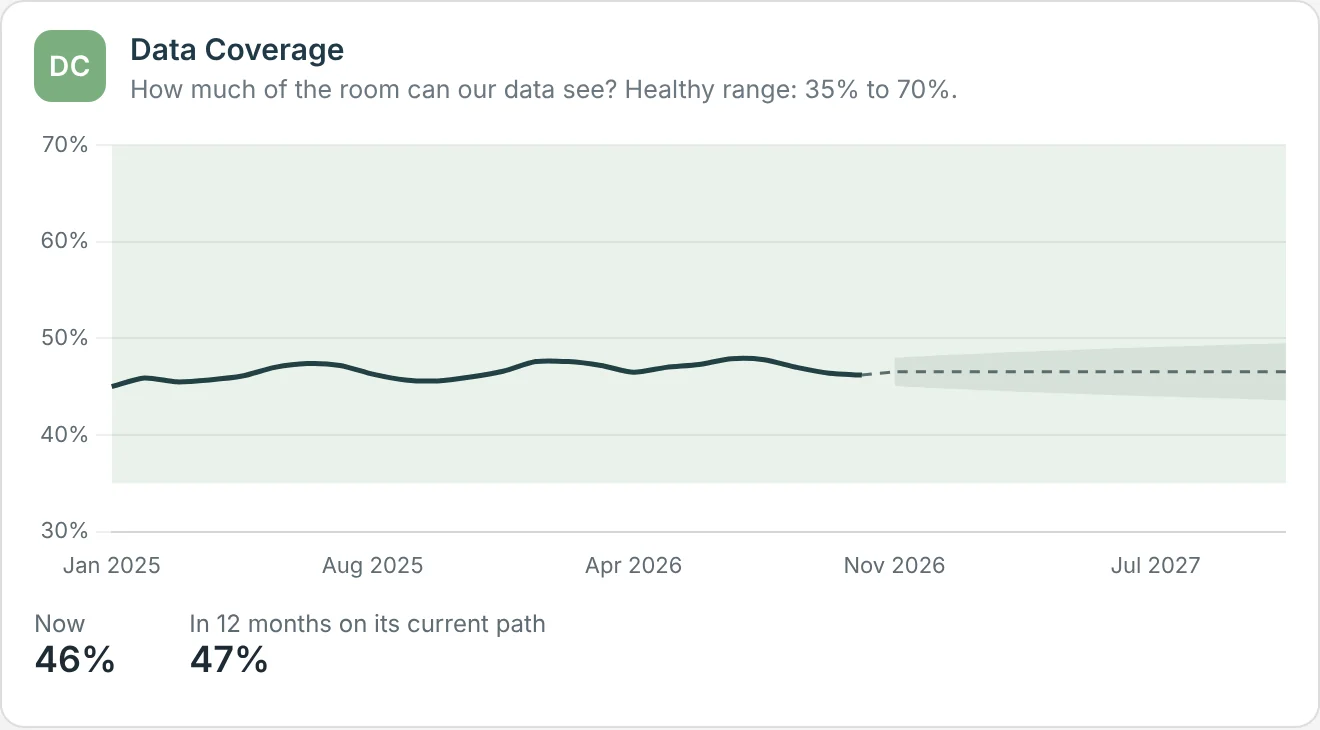
Illustrative. About 610 adults with Sunday evidence against an adult headcount of 1,329. Data Coverage is 46%.
Healthy range
The range is a starting point from the sample church. Your church’s own history sets the real one.
What moves it
No catalyst moves it. It rises where a church takes adult check-in. You don’t activate a Church Vital, and this one isn’t about people at all. It’s about how much of the room your data can see.
Watch out for
About a third of Sunday involvement in the sample church is Likely, not observed. Likely is a weak guess.
See also:The 10 Church Vitals · All 13 Church Catalysts · Example churches
Your church picks the method. We help you see whether it’s working. If you’d like help with this, apply to be a Founding Client or request a 45-minute Discovery Meeting.