How it’s counted
Adults in a small group, serving and giving, out of active adults.
For example
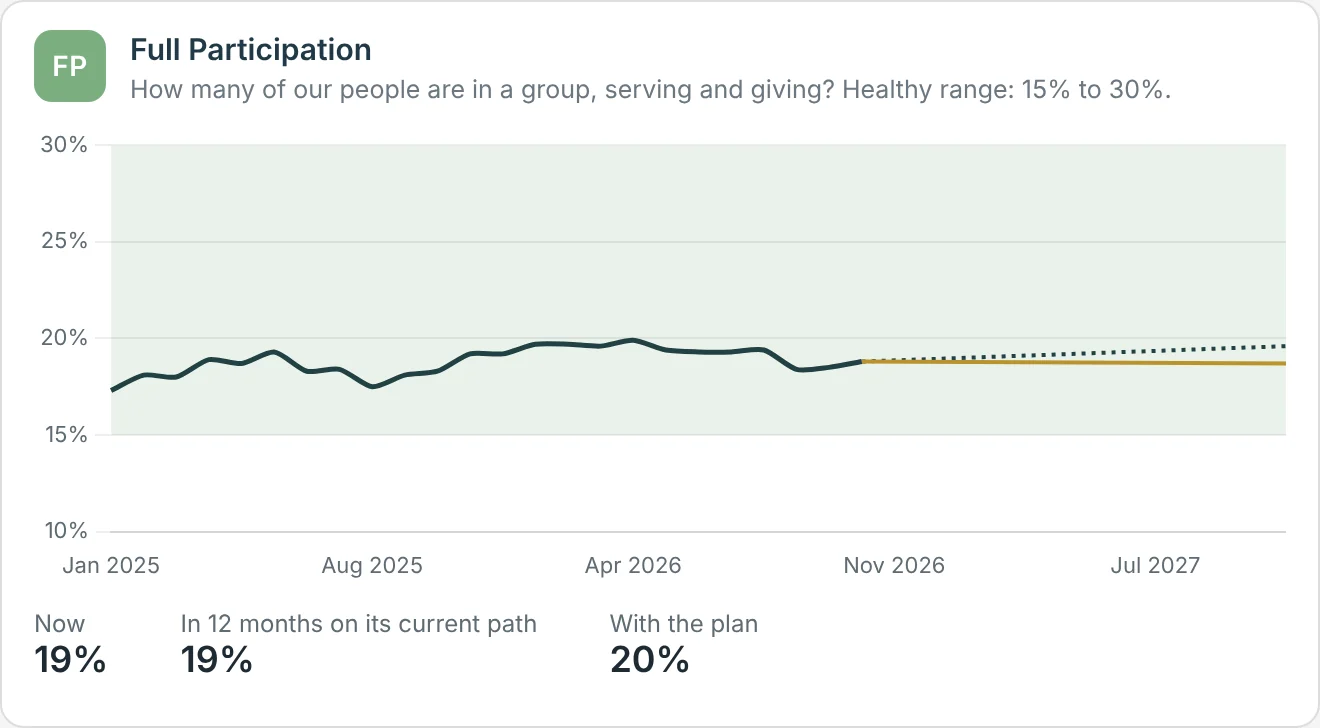
Illustrative. 576 of 3,060 active adults are in a group, serving and giving. Full Participation is 19%.
Healthy range
The range is a starting point from the sample church. Your church’s own history sets the real one.
What moves it
Group Connection, Serving Connection and Giving Connection lead here. First 90 Days starts new people toward it. You don’t activate a Church Vital. It moves because the Church Catalysts do.
Watch out for
In the 12-month model it is an estimate built from the overlap of the three areas. The history on the chart is the real count.
See also:The 10 Church Vitals · All 13 Church Catalysts · Example churches
Your church picks the method. We help you see whether it’s working. If you’d like help with this, apply to be a Founding Client or request a 45-minute Discovery Meeting.