Most church leadership teams meet every week, and most of those meetings start with last Sunday: how many came, what the offering was, how the new series landed.
Those numbers matter. But they’re results. They tell you what happened, not what to do next. A headcount can’t tell you whether to start more groups, recruit more leaders or work on how guests are welcomed. And it can’t tell you whether people are moving toward devotion to Jesus or standing still.
That’s what a good dashboard is for.
What it is, and what it isn’t
A church dashboard brings together data your church already has: your church management system, check-in, groups, serving and giving. On their own, those systems each tell part of the story. Joined, they show the path people are actually taking from a first Sunday into the life of the church.
Ours shows counts, not names. Names are visible only to the staff your church authorizes. It shows participation, not faith, and no person ever gets a score. Giving counts as yes or no for each person, based on whether their household gives. Amounts appear only as church-wide totals.
What a leadership team looks at
Three things, in this order.
- The path. How many people come only on Sundays? How many are in a group, serving or giving? How many have all of it? And are people moving deeper this month, or slipping back quietly?
- The Season Plan. Two or three Church Catalysts your church has chosen to activate this season, each with one owner, one goal and one date. Each shows a trend and two forecasts: where it lands on its current path, and where it lands with the Season Plan.
- The Church Vitals. Ten measures in four groups: Participation, Room, Leaders and volunteers, and Foundations. Each has a healthy range, and both ends are a problem. A full room, a thin bench or worn-out volunteers show up here before they become a crisis.
The rhythm
The data refreshes daily, but most church data is weekly, so the full picture lands Sunday night after the last service. Your leadership team reads it in the meeting it already keeps. Once a month, we read it together and adjust the plan.
That’s the point of the rhythm: the conversation shifts from “How was Sunday?” to “Are people moving, and is our plan helping?”
An example (Illustrative)
Sage Ridge Community Church is a fictional church we built to show how this works. In its thriving version, every Church Vital is in its healthy range and every catalyst sits at a high bar. Few churches look like this, and that’s the point: it shows what a Season Plan adds even when nothing is wrong. The other eight versions each face one condition, like a full room or a thin bench, and a real church may be facing more than one.
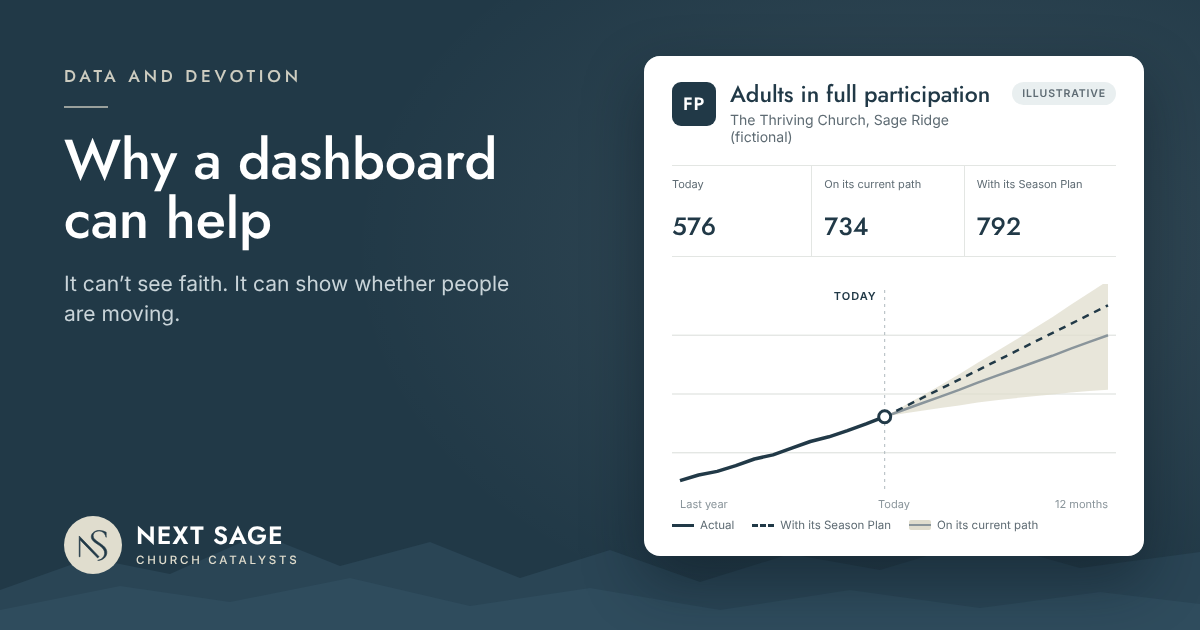
On its current path, Sage Ridge goes from 576 adults in full participation to 734 in twelve months. That’s a strong year. Its Season Plan, which activates Bench to Leader, First 90 Days and Sunday Rhythm, adds 58 more, to 792.
Those are forecasts, not promises. What they give a leadership team is a clear picture of what its choices are likely to do, before it commits a season to them. And they answer a question every church can ask, thriving or not: is there anything we could activate to reach and lead more people toward devotion to Jesus?
What it can’t do
A dashboard can’t tell you why someone stopped coming. It can’t see whether someone feels known. It can’t see who a leader is investing in, or whether a person is becoming devoted to Jesus.
It points. People lead. My own faith was shaped one conversation at a time, and no dashboard will ever schedule that. But a church can make room for it, and a dashboard can show whether it is.
Related reading: The role of data in leading people toward devotion to Jesus · The main thing: is your church doing its part?
We bring experienced church leadership and your church’s own data together to build your Season Plan. If you’d like help with this, apply to be a Founding Client or request a 45-minute Discovery Meeting.